Research question
When does a learned momentum strategy improve on classical trend-following rules, and what distinguishes its strongest and weakest deployment windows? This study examines performance dispersion and model behaviour rather than proposing a new neural-network architecture.
The work was completed by Cristóvão Matos for Mathematics for Machine Learning at Instituto Superior Técnico. This summary presents the academic study in the context of Nomera’s broader research interests.
Method
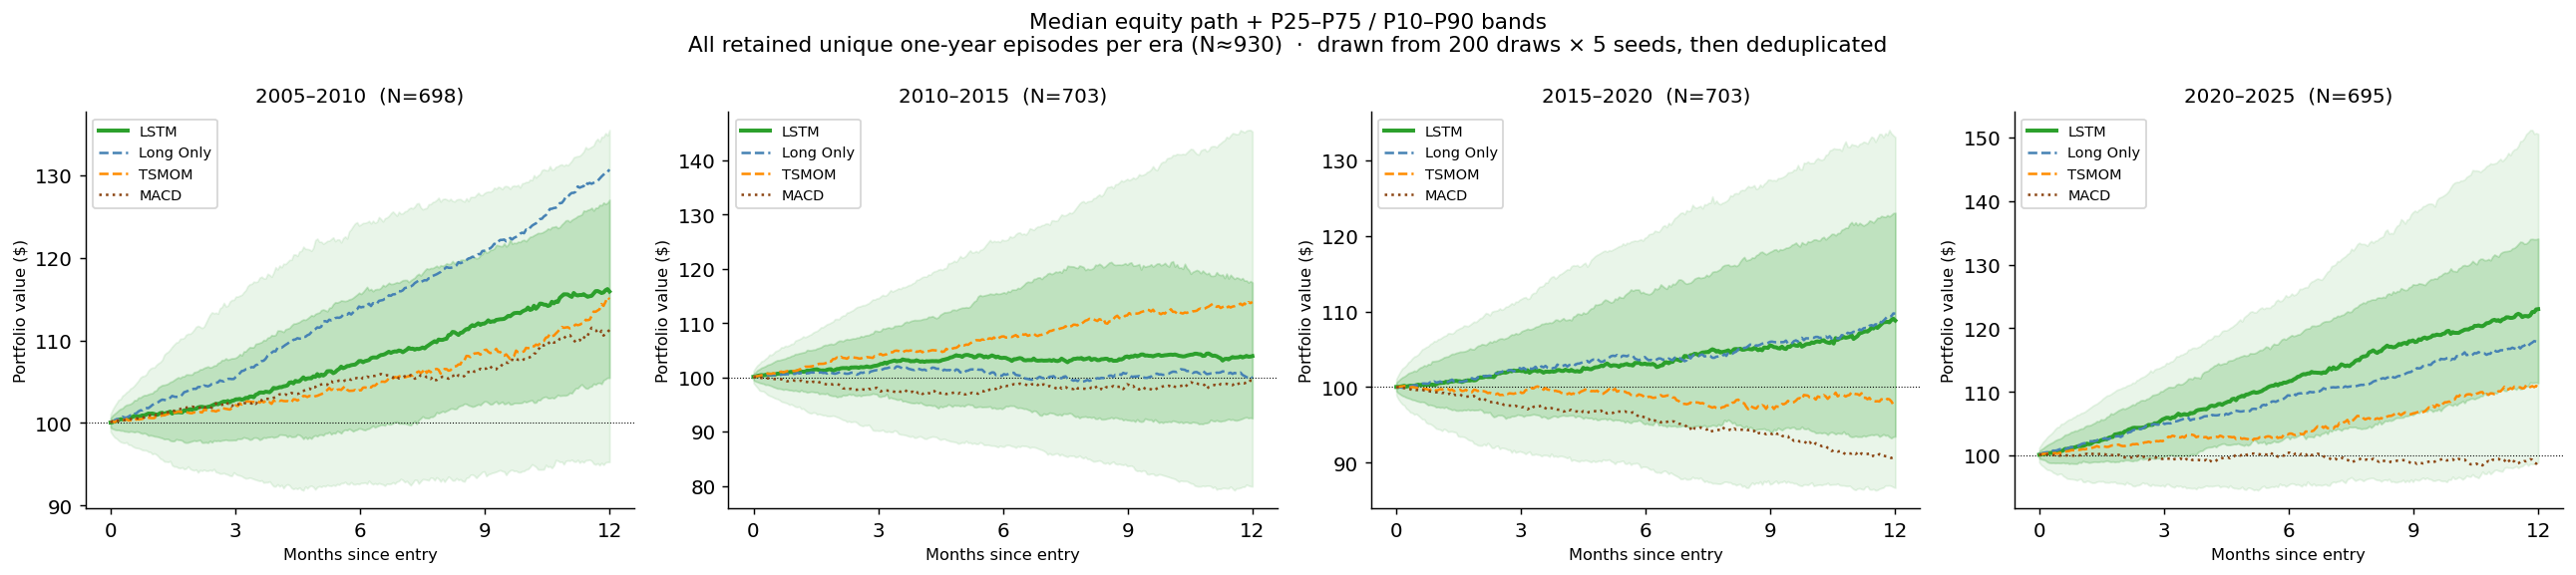
The analysis uses daily Refinitiv futures data for 26 instruments across equity indices, fixed income, commodities and other futures markets. Four test eras cover 2005–2010, 2010–2015, 2015–2020 and 2020–2025, with five model initialisations per era.
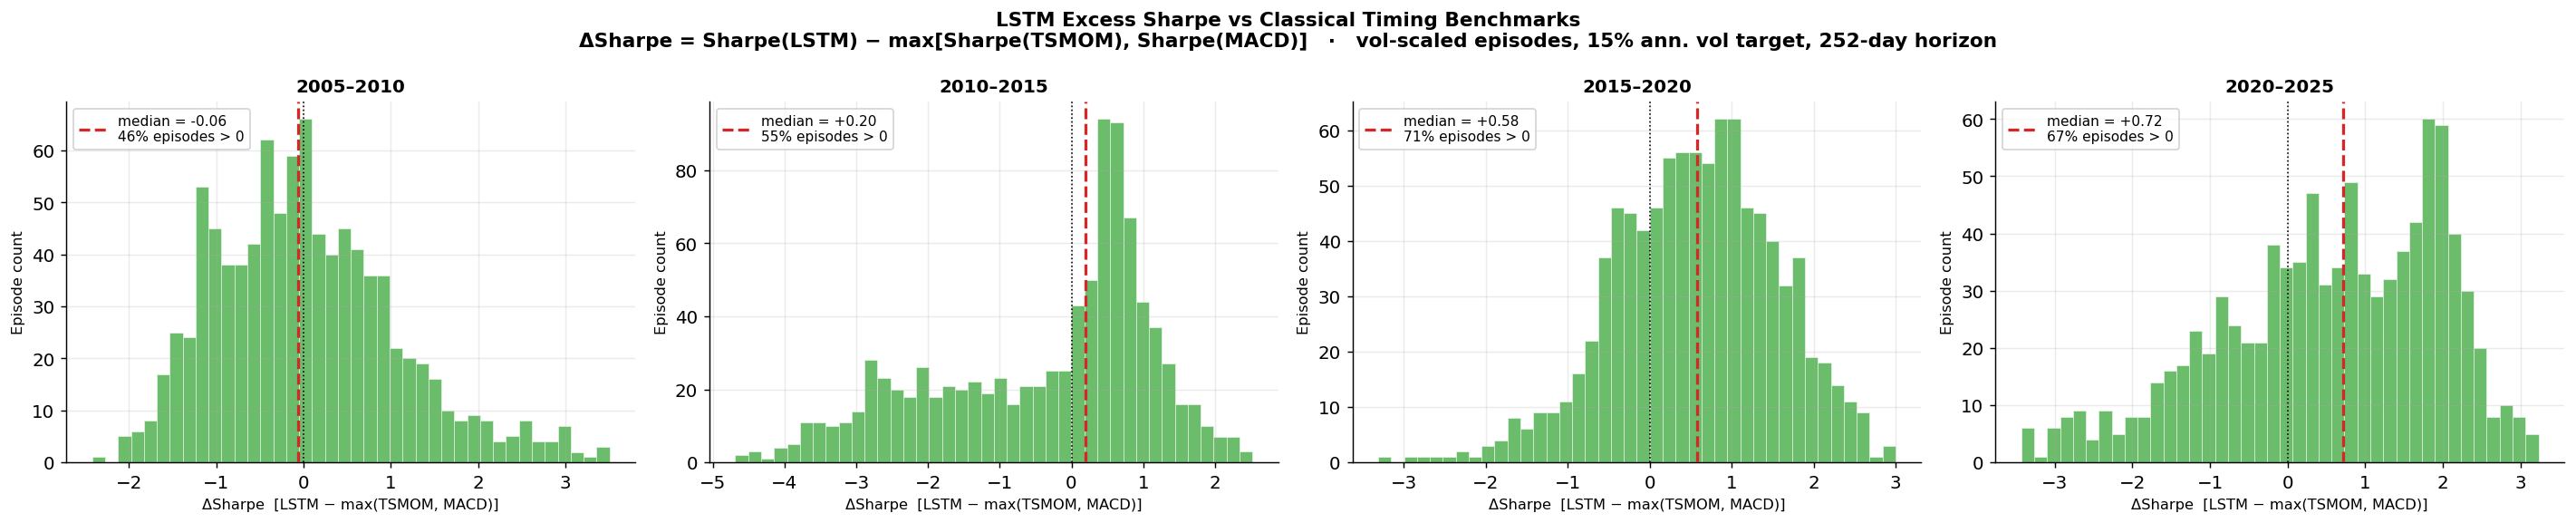
An LSTM receives 63-day sequences of normalised momentum and MACD features and produces bounded long/short position signals. Training and validation precede each test era. The model is compared with Long Only, time-series momentum (TSMOM) and MACD over paired one-year windows.
The study retains 3,722 unique episode records after removing duplicate episode keys. These windows overlap in calendar time: they are not 3,722 independent market histories. A subset of 160 tail episodes supports diagnostics of position changes, directional errors, feature attribution and instrument-level contributions.
Each instrument has an equal base portfolio sleeve. The model controls signed exposure within each sleeve; it does not learn a cross-asset capital-allocation policy. Ex-post rescaling to a common volatility is a diagnostic comparison, not an executable ex-ante risk rule.
Main results
The LSTM does not provide a universal momentum advantage. Its results are weaker or inconsistent in the earlier eras and more competitive after 2015, particularly during 2020–2025. Even in stronger eras, some deployment windows materially underperform classical timing rules.
Higher turnover and more frequent sign changes are associated with stronger gross timing performance in the diagnostic sample. Frequent activity alone therefore does not explain failure. Repeated wrong-sided decisions are a more important breakdown diagnostic, while output saturation appears as a warning sign in some regimes.
Integrated Gradients helps describe which input features influence model positions. Feature patterns vary by era and remain exploratory: attribution to a position output does not establish what caused realised profit or loss.
Limitations and next steps
- Results exclude transaction costs. An association between useful switching and gross returns may weaken after trading frictions.
- Overlapping episodes and selection of extreme outcomes limit inference; diagnostic associations should not be read as causal or independent-sample evidence.
- The best classical benchmark is identified within each realised episode as an evaluation reference, not as a benchmark-selection rule available in advance.
- The futures universe and diagnostic sample are limited. Broader coverage, sensitivity tests and an explicit ex-ante regime model are natural extensions.
Relevance to Fundraxis
This work informs the design of research tools that compare models with transparent baselines, expose performance dispersion and make failure modes inspectable. It supports a direction for model evaluation and monitoring within Fundraxis; it does not describe a deployed trading strategy or a validated product feature.