Research question
Can the geometry of a yield surface help determine when a fixed-income exposure is appropriate? The study treats yields as a surface evolving across both maturity and time, and explores whether regime-conditioned exposures behave differently from a continuously held butterfly strategy.
The work was completed by Cristóvão Matos for Fixed Income Securities at NOVA IMS. Its central contribution is a proposed diagnostic framework, rather than a forecast of interest rates or a deployable investment strategy.
Method
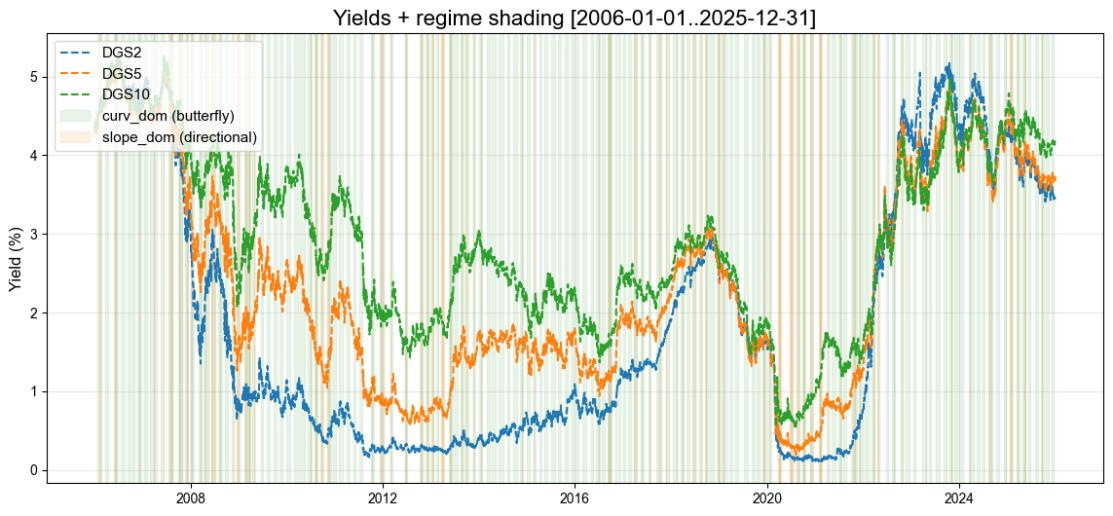
The report uses U.S. Treasury constant-maturity yields from FRED over 2006–2025. A Nelson–Siegel–Svensson curve is fitted for each observation date. Level, slope, curvature and second-order surface diagnostics, including a Hessian and a time–maturity coupling measure, describe the local configuration.
Regime rules select between a synthetic curvature exposure, a synthetic directional exposure and no exposure. The comparison strategy continuously holds a synthetic 2–5–10-year butterfly. Decisions use information available up to the decision date, with the report specifying execution from the following day and rebalancing every 21 trading days.
The evaluation combines a full-sample backtest with paired, randomly selected four-year windows. Returns are approximated from yield changes, duration and carry; they are not realised returns from a portfolio of traded securities.
Main results
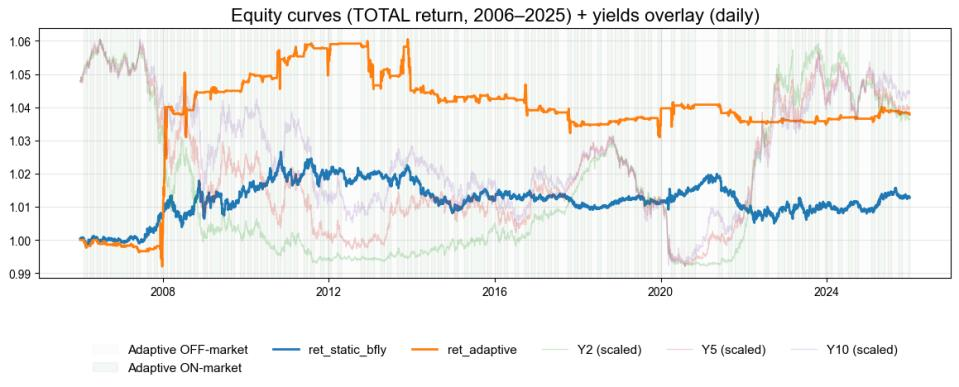
In the full-sample table, the adaptive strategy reports annual return of 0.179% versus 0.061% for the static butterfly, and Sharpe of 0.203 versus 0.103. The absolute returns and risk-adjusted ratios are modest.
The risk comparison is mixed. Full-sample maximum drawdown is higher for the adaptive strategy, at 2.789% versus 2.103%; annual volatility and CVaR are also higher, while VaR is lower. These results do not support a general claim that regime conditioning reduces every dimension of risk.
Across the sampled four-year windows, the report records a lower median drawdown for the adaptive approach and higher Sharpe in approximately 60% of paired windows. Return distributions overlap substantially and extreme-tail improvements are not consistent. These are descriptive findings from the specified experiment, not proof of an enduring advantage.
The report also attributes a disproportionate share of lifetime adaptive returns to the Global Financial Crisis, especially its directional exposure. This concentration matters when assessing how well the result generalises.
Limitations and next steps
- Synthetic instruments exclude transaction costs, financing frictions, roll-down and convexity beyond the first-order approximation. References to such effects in the original discussion should not be read as measured contributions.
- The adaptive strategy changes both participation and exposure type. Additional controls are needed to separate the effect of the geometric filter from switching into directional exposure or remaining flat.
- Second-order derivatives can be sensitive to smoothing, estimation noise and the relative scaling of time and maturity. The geometric interpretation requires sensitivity checks and does not itself establish economic stability or predictability.
- Overlapping windows do not create independent histories. Reproducible validation should document threshold calibration, strictly causal derivative estimation and robustness to alternative samples and conventions.
- Validation with tradable instruments and realistic costs is needed before drawing implementation conclusions.
Relevance to Fundraxis
The framework suggests a research direction for term-structure visualisation, regime diagnostics and exposure monitoring. It also connects with Nomera’s interest in volatility surfaces and changing market conditions. Such tools could inform future Fundraxis research workflows, subject to their own empirical validation; no operational feature or performance claim is implied.